Hospital Charges by State: Which States Are Most and Least Expensive?
We analyzed the average costs of the top ten hospital services by state to better grasp the United States' financial burden of healthcare.

About half of U.S. adults (47%) say it’s challenging for them to afford healthcare, leading many to skip or delay tests or treatments recommended by their doctor.1 Those without insurance are more likely to skip a recommended test or treatment due to the cost than those with insurance. But a third of those with insurance (37%) still reported not getting a recommended test or treatment for this reason.1
One in four U.S. adults says they have difficulty affording the cost of prescription drugs, with about a quarter (23%) claiming they or a family member have not filled a prescription, cut pills in half, or skipped doses because of the cost. And even more adults (41%) say they have some form of debt due to medical or dental bills, with nearly a quarter (24%) claiming to have bills that are past due or that they’re unable to pay.1
Nearly all of these cost-related healthcare issues disproportionately affect lower-income adults, the uninsured, Black and Hispanic adults, and women.1
To better understand the financial burden healthcare places on so many Americans, we took advantage of the Hospital Price Transparency rule to analyze the expenses of the ten most common medical services in the U.S. Our objective is to offer a helpful price guide that can assist individuals in navigating these costs.
Jump to:
Key takeaways
- Urban areas and coasts typically have higher healthcare costs
- Nevada is by far the most expensive state for hospital services
- Alaska is the most expensive state for cesarean deliveries and exchange of prosthetic lens procedures
- Minnesota offers the best deal on four out of ten of the hospital services we analyzed
- New York is the most expensive state to get an upper endoscopy or a heart bypass procedure
Overview
Using data acquired from FAIR Health (an independent, national nonprofit organization that provides fair and neutral information regarding healthcare costs and insurance), we analyzed the ten most common services and surgeries for the highest populated zip code in each state. All data shown, unless specifically labeled, are averages of both in-network and out-of-network costs.
After a relatively small increase of 2.7% compared to the previous year's 10.3% increase, healthcare spending in the U.S. reached $4.3 trillion in 2021.2 According to the 2021 National Health Expenditures (NHE) Report issued by the Office of the Actuary at the Centers for Medicare & Medicaid Services (CMS), the hindered growth of overall spending was largely due to decreased federal government spending, which dropped by 3.5% as a result of reduced COVID-19 support and federal public health activity.2
In 2021, households accounted for nearly the same share of total healthcare spending as the federal government (27% and 34%, respectively). The three most costly areas were hospital care ($1.3 trillion), physician and clinical services ($864.6 billion), and retail prescription drugs ($378 billion).2
Effective January 1, 2021, CMS issued a final rule for Hospital Price Transparency intending to provide Americans with a better understanding of healthcare costs and spending.3 This rule requires hospitals to disclose certain information about the cost of items and services, including rates negotiated with insurers, discounts for cash payments, and billing codes.
Additionally, the rule states that insurance plans must include in-network negotiated rates, out-of-network costs and allowed amounts, the negotiated rates and historical net prices for prescription drugs, and an Internet-based tool for consumers to search for this information.3 4 You can find more details on the Centers for Medicare & Medicaid Services page dedicated to hospital price transparency.
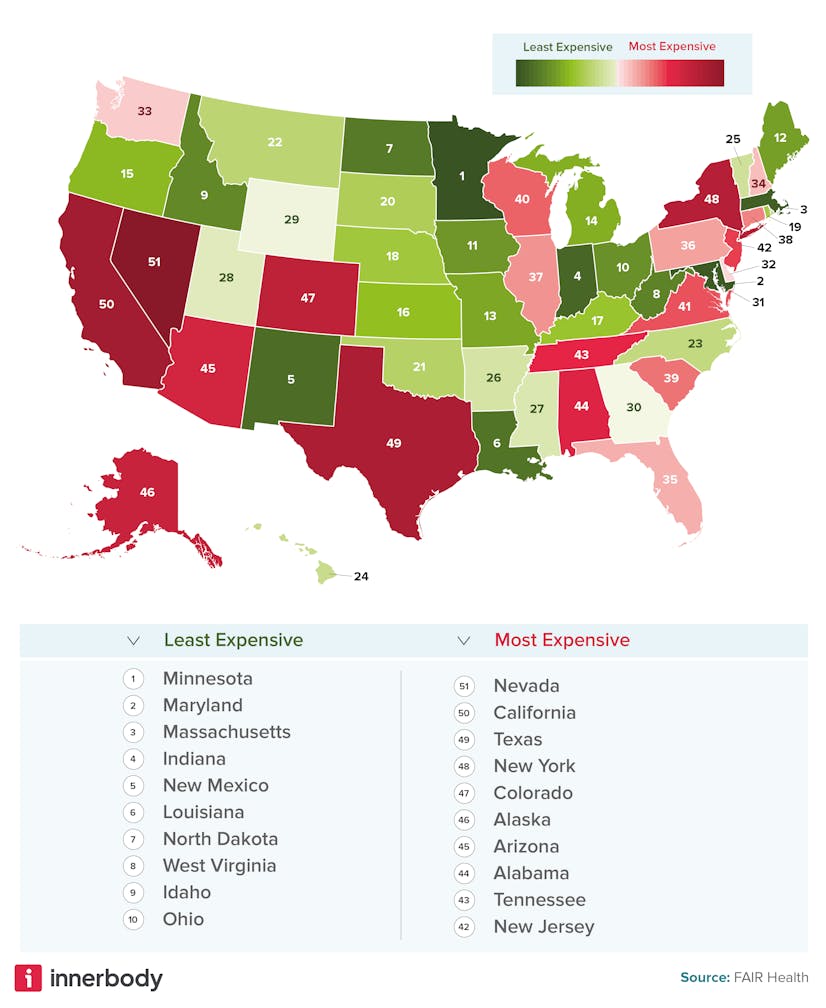
Most and least expensive states for medical services

The most affordable states
According to our research, the top five most affordable states for medical procedures are:
- Minnesota
- Maryland
- Massachusetts
- Indiana
- New Mexico
According to our data analysis, Minnesota is the state with the most affordable medical procedures, and the remaining states with the lowest costs are geographically dispersed across the United States.
However, we did see a clustering of relatively affordable states throughout the Midwest region. This trend could be attributed in part to the lower cost of living generally found in this area, but it could also be due to the implementation of federally-backed health initiatives. For example, the Center for Medicare and Medicaid Innovation (CMMI) awarded Minnesota with a $45-million State Innovation Model (SIM) testing grant in 2013, with the goals of:5
- Improving community health
- Providing better care
- Lowering healthcare costs
Additionally, one of the Minnesota Department of Health’s goals was to have the majority of providers participating in Account Care Organization (ACO) or similar models by 2017 so that they could be held more accountable for costs and quality of care.5 6 Overall, these factors may add up to how Minnesota earned the top spot for healthcare affordability.
The most expensive states
The top five most expensive states for the hospital services we identified are:
- Nevada
- California
- Texas
- New York
- Colorado
According to our findings, Nevada’s healthcare costs are significantly more expensive than California's. In fact, in 2014, Nevada was ranked fourth in the nation in terms of inflated healthcare costs, charging around $448 for every $100 that went to overall operational costs — well above the national average of $331 per $100.7
Given the correlation between for-profit hospitals and higher overall charges, it might not be surprising to learn that roughly 55% of Nevada’s hospitals (26 of 47) are for-profit institutions. (Texas, in third place, has 517 hospitals, 266 of which operate using a for-profit model, or 51%.) This could partially explain the significantly higher-than-average costs of common services.8
California has a smaller percentage of for-profit hospitals (86 out of 358; 24%), but Californians appear to be spending a disproportionately high amount on private health insurance: $125 billion compared to the $174 billion contributed by Medicare and Medi-Cal combined. Per capita spending also continues to increase, growing at an annual average rate of 5.2%, one percentage point faster than the average U.S. rate of 4.1%. In 2020, per capita spending in California exceeded the U.S. average for the first time.9
Procedure costs by state

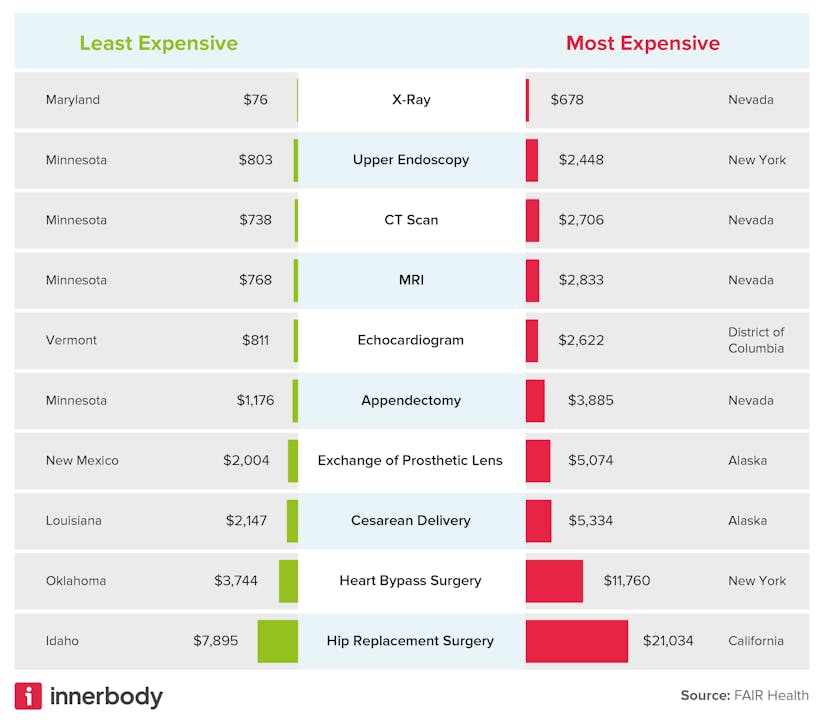
In addition to the assistance provided by Minnesota’s SIM testing grant, the state’s healthcare system is subject to heavy regulation by the state government, which has led to a more competitive healthcare market and lower healthcare costs for consumers. The state government also regulates MNSure, Minnesota's health insurance marketplace, where individuals and families can shop for and compare health insurance coverage options.16 This could be why Minnesota offers the best deal on four out of ten of our identified hospital services:
- Appendectomy ($1,176)
- MRI ($768)
- CT scan ($728)
- Upper endoscopy ($803)
Nevada, however, was found to have the most services with the highest average cost. Besides Nevada’s disproportionate number of for-profit hospitals, the state’s increased healthcare costs could be attributed to factors such as limited competition among healthcare providers and higher malpractice insurance premiums. The most expensive services in Nevada include:
- X-ray ($678)
- CT scan ($2,706)
- MRI ($2,833)
- Appendectomy ($3,855)
The advanced technology and equipment required for services like CT scans, MRIs, and appendectomies can be expensive to acquire and maintain. This means the cost of that investment could be reflected in the higher prices charged for these services.
According to our analysis, New York is the most expensive state to get an upper endoscopy ($2,448) or a heart bypass procedure ($11,760). Employer-based health insurance in New York, which has historically cost more than plans in other states, is becoming increasingly more expensive — with the average cost of premiums reaching $8,542 in 2022. New York’s health insurance premiums are now nearly 16% higher than the national average of $7,380.17
The only state with higher premiums is Alaska ($9,037), largely due to its unique population demographics. This is likely why we found Alaska to be the most expensive state for both cesarean deliveries ($5,334) and the exchange of prosthetic lens procedures ($5,074). Alaska has the highest per capita health expenditures among all states (overshadowed only by the District of Columbia), and the individual cities of Juneau, Fairbanks, and Anchorage have the highest healthcare costs in the nation.18 On top of sky-high insurance premiums, Alaska has also experienced higher annual percentage growth in healthcare costs than any other state since 1991. Several factors contribute to Alaska's high healthcare costs, including:18
- Small population size
- Remote areas
- A limited number of medical providers
- Limited competition
- High compensation rates for specialty physicians
- High hospital profit margins
- Risky patient behavior patterns
State regulations, such as the “80 percentile rule,” — which requires insurance companies to base their payments for out-of-network claims on the amount at or above 80% of what all the providers charge for a specific service in a given area of the state — have also contributed to disproportionately high costs. Anchorage, too, Alaska’s largest city by population, lacks government-operated and teaching hospitals that are open to all patients.18
In-network vs. out-of-network costs

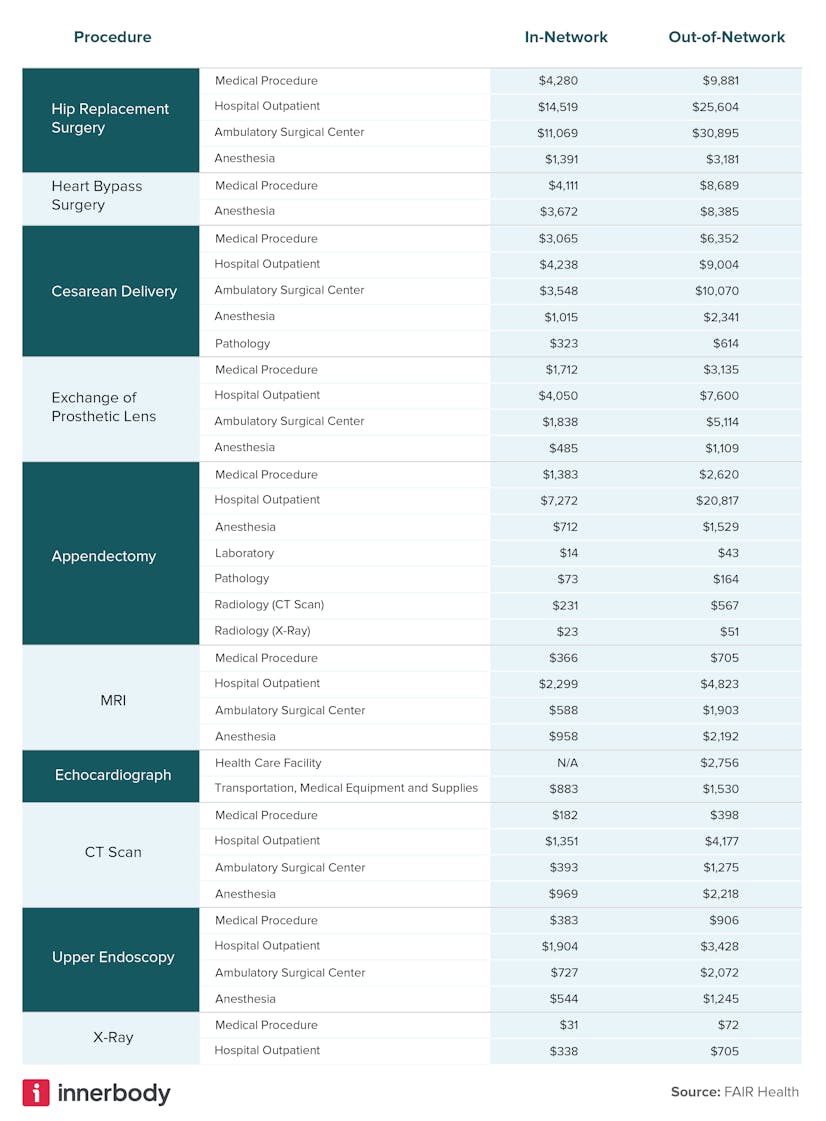
Whether performed in- or out-of-network, a total hip replacement is significantly more expensive than the other services we identified, but the procedure itself typically appears as one of the smallest charges on an itemized hospital bill. For example, an in-network hip replacement may cost $4,280, but the outpatient cost can be up to $14,519 — a difference of over $10,000.
The second most expensive procedure to have is an upper endoscopy, which, on average, also comes with a significant increase of 46% when using an out-of-network provider. On the other hand, cesarean deliveries are the least expensive procedure to have done out-of-network, with an average difference of only 33%.
Other factors that can influence the cost of many operations include:
- Materials - durable and long-lasting materials can be expensive to manufacture and purchase
- Surgical expertise - higher levels of surgeon expertise often come with higher costs
- Hospital stay - this often includes nursing care, medications, room costs, and more
- Follow-up care - this might involve physical therapy or regular check-ups
- Insurance - it may only cover a portion of the bill
The cost of complications
Understanding the costs associated with common hospital procedures is important in terms of financial planning, but the average cost of inpatient surgery could also be an indicator of hospital quality. According to one study, hospitals with higher complication rates end up charging more than hospitals with lower rates, suggesting that physician services, re-admissions, and post-discharge care all contribute to increased costs that ultimately land on patients.15
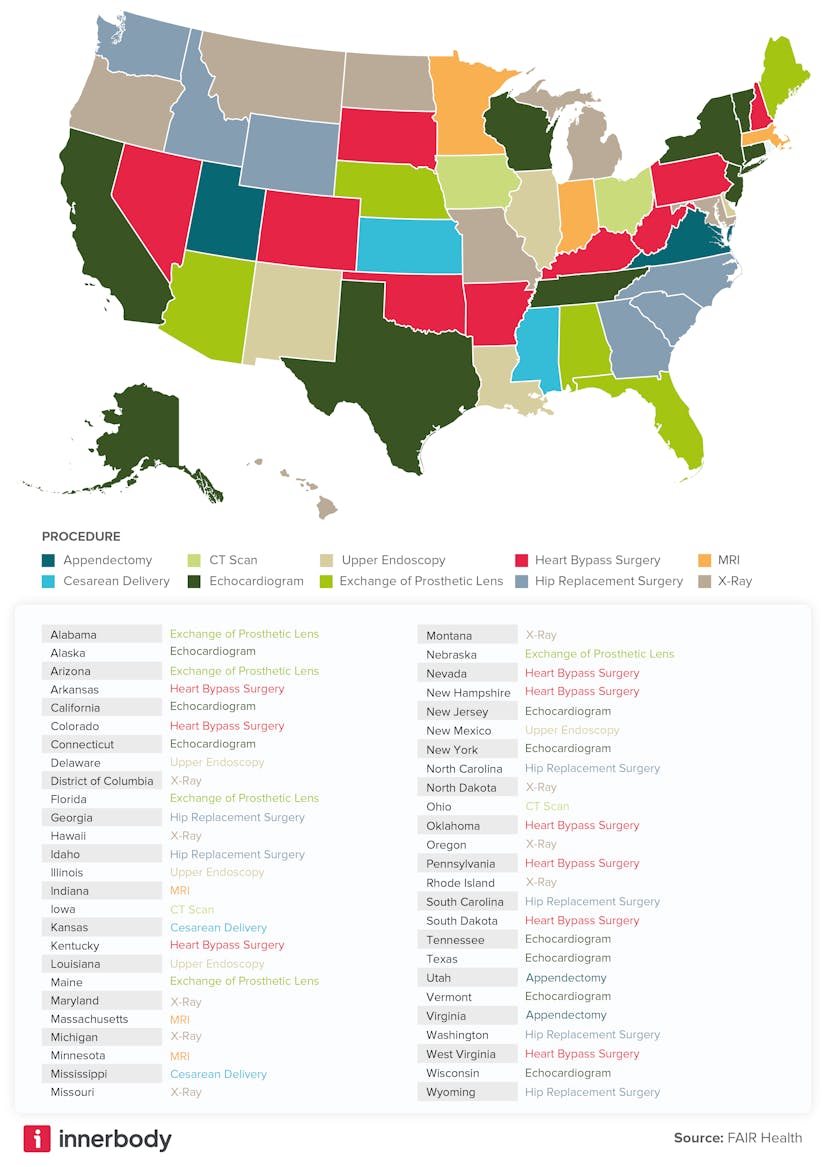
Best bargain on hospital services by state

To determine which state offers the best value for certain hospital services, we first identified the ten most common procedures. The list below details these services along with Current Procedural Terminology (CPT) codes.
- Appendectomy (44950)
- Exchange of prosthetic lens (66986)
- Cesarean delivery with care before and after delivery (59510)
- CT scan of the abdomen, before and after contrast (74170)
- Transthoracic echocardiogram (TTE) (C8921)
- Heart bypass surgery; coronary artery bypass surgery with one vein graft (33510)
- Total hip replacement after previous hip surgery (27132)
- MRI scan of the brain with contrast (70552)
- Upper endoscopy (43235)
- X-ray of ribs on side of body, minimum of three views (71101)
Next, we calculated the national and state cost averages for each service. And finally, we used the percentage difference between the two averages to determine which state offers the best bargain for each procedure.
A clear variation in healthcare costs and utilization can be observed across the different states, suggesting that a range of factors, such as the availability of healthcare providers, local competition, and the prevalence of certain medical conditions, can influence the cost of healthcare services. Additionally, regional demographics and economic influences can also play a role in healthcare costs.
Physician preference
The frequency of surgical procedures varies widely across the U.S. This is partially due to variations in illness rates, diagnostic methods, and patient attitudes toward medical intervention. However, research suggests that differing rates of surgical interventions are mainly influenced by the varying beliefs of physicians regarding when surgery is necessary. Broader influences include available technology, training, regional supply of surgeons, local regulations, and financial incentives.10
Geographic variation
When people move to an area with higher (or lower) healthcare spending, their medical spending also tends to increase (or decrease). Research suggests that nearly half (42%) of the differences in healthcare spending across the U.S. can be attributed to factors within the local healthcare system. There is also evidence to suggest that one of the factors contributing to regional differences in healthcare spending is the frequency at which those services are utilized.11
Additionally, our research found that urban locations and the coasts, both east and west, generally have more expensive medical procedure costs than other areas.19 This is likely due to higher population density and more regulations that can lead to increased administrative costs for healthcare providers.19 20 21
Coronary artery bypass surgery
Coronary artery bypass surgery, the second most expensive procedure on our list, costs $6,233 on average in the U.S. This procedure is available for the best bargain (a cost furthest below the national average) in these states:
- Arkansas
- Colorado
- Kentucky
- Nevada
- New Hampshire
- Oklahoma
- Pennsylvania
- South Dakota
- West Virginia
Interestingly, hospitals in Colorado (number two on the list) reportedly charge more, have higher costs, and report higher profit margins than those in any other state. This is because both for-profit and nonprofit hospitals in Colorado have taken steps to maximize revenue and profits, including consolidating into a handful of powerful networks.12 This consolidation undercuts the negotiating power of the state’s relatively smaller insurance companies when they attempt to hold down prices. This strategy to maximize profits may allow Colorado’s hospitals to charge less for more complex surgeries.
Total hip replacement
Total hip replacement surgery, the most expensive service on our list, costs on average $12,699 in the U.S. and is available for the best bargain in these states:
- Georgia
- Idaho
- North Carolina
- South Carolina
- Washington
- Wyoming
Other estimates place the cost of this procedure somewhere between $30,000 and $112,000.13 Given that insurance companies only pay a portion of the amount billed, it can be difficult to identify and truly compare charges for such an extensive operation. Common factors that can influence overall cost include:
- Billing practices
- Implant prices
- Hospital charges
- Cost of postoperative services
The cost of surgery can also vary significantly based on the average cost of rent, malpractice insurance, and facility maintenance — all factors highly specific to a given region.
Medical tourism
A range of medical services and procedures can be performed at a fraction of the cost in foreign countries. This cost disparity has given rise to a booming medical tourism industry, or the practice of traveling to another country specifically for medical treatment.14 Each year, millions of U.S. residents travel to Mexico, Canada, Central America, South America, the Caribbean, and elsewhere to get access to healthcare they can’t afford or receive promptly at home. There are also plenty of people who wish to see a doctor that shares their native language or better understands their culture.14
The most common procedures that medical tourists undergo include:14
- Dental care
- General surgery
- Cosmetic surgery
- Fertility treatments
- Organ and tissue transplantation
- Cancer treatment
There are also several risk factors to be aware of, many of which depend on the procedure you’re getting, as well as your physical and mental condition. Some of these include:14
- Infectious disease
- Antibiotic resistance
- Quality of care
- Communication challenges
- Dangers of postoperative air travel
- Postoperative or follow-up care
To minimize the risks associated with medical tourism, the CDC recommends bringing copies of your medical records, packing a travel health kit, and confirming the qualifications of the healthcare provider and facility you intend to visit. It’s also a good idea to identify where you’ll be staying after your procedure and ensure you’ll be able to receive adequate follow-up care when you return home.14
Methodology
Using data acquired from FAIR Health (an independent, national nonprofit organization that provides information regarding healthcare costs and insurance), we analyzed the ten most common procedures for the highest populated zip code in each state. We also used the data to investigate the price differences between in-network costs and out-of-network costs. Additionally, we used data from many different sources (including the CDC, NIH, Cleveland Clinic, Harvard, Johns Hopkins Medicine, the BMJ, and others) to weight these state expenses based on the prevalence of the services or procedures.
Fair use statement
Innerbody Research is committed to providing objective, science-based suggestions and research to help our readers make more informed decisions regarding health and wellness. We invested the time and effort into creating this report to take advantage of the Hospital Price Transparency rule and provide a useful price guide for the ten most common procedures in the U.S. We hope to reach as many people as possible by making this information widely available. As such, please feel free to share our content for educational, editorial, or discussion purposes. We only ask that you link back to this page and credit the author as Innerbody.com.
Sources
Innerbody uses only high-quality sources, including peer-reviewed studies, to support the facts within our articles. Read our editorial process to learn more about how we fact-check and keep our content accurate, reliable, and trustworthy.
Kearney, A. F. & Montero, A. (2022). Americans’ Challenges with Health Care Costs. KFF.
Centers for Medicare & Medicaid Services. (2022). Press Release: National Health Spending Grew Slightly in 2021. CMS.
United States Health and Human Services Department. (2019). Medicare and Medicaid Programs: CY 2020 Hospital Outpatient PPS Policy Changes and Payment Rates and Ambulatory Surgical Center Payment System Policy Changes and Payment Rates. Price Transparency Requirements for Hospitals To Make Standard Charges Public. Federal Register.
Centers for Medicare & Medicaid Services. (2020). Transparency in Coverage Final Rule Fact Sheet (CMS-9915-F). CMS.
The Minnesota Department of Health (MDH), & The Minnesota Department of Human Services (DHS). (2013). Minnesota Accountable Health Model - SIM Minnesota. The State of Minnesota.
Centers for Medicare & Medicaid Services. (2022). CMS Redesigns Accountable Care Organization Model to Provide Better Care for People with Traditional Medicare. CMS.
National Nurses United / IHSP. (2017). Nevada Ranks 4th In Nation In High Hospital Charges. NNU.
Kaiser Family Foundation. (2023). Hospitals by Ownership Type. KFF.
Wilson, K. (2023). 2023 Edition - California Health Care Spending. California Health Care Foundation.
Birkmeyer, J. D., Reames, B. N., McCulloch, P., Carr, A. J., Campbell, W. B., & Wennberg, J. E. (2013). Understanding of Regional Variation In the Use of Surgery. U.S. National Library of Medicine.
Johnson, W. C., & Biniek, J. F. (2020). Sources of Geographic Variation in Health Care Spending Among Individuals With Employer Sponsored Insurance. U.S. National Library of Medicine.
Booth, M. (2021). Colorado Hospitals’ Profit Margins Are Nation’s Highest as State Lawmakers Move to Cap Health Care Costs. ColoradoSun.
American Association of Hip and Knee Surgeons. (n.d.). Total Joint Replacement: A Breakdown of Costs. AAHKS.
Centers for Disease Control and Prevention. (2023). Medical Tourism: Travel to Another Country for Medical Care. CDC.
Birkmeyer, J. D., Gust, C., Dimick, J. B., Birkmeyer, N. J. O., & Skinner, J. S. (2012). Hospital Quality and the Cost of Inpatient Surgery in the United States. U.S. National Library of Medicine.
MNsure. (n.d.). What Is MNsure? The State of Minnesota.
Reisman, N. (2022). New York’s Health Insurance Premiums Continue to Outpace Much of U.S. Spectrum News 1.
Alaska Common Ground. (2017). High HealthCare Costs in Alaska: Facts, Causes, Consequences, and Remedies. Alaska Common Ground.
Williams, D., Jr, & Holmes, M. (2018). Rural Health Care Costs: Are They Higher and Why Might They Differ from Urban Health Care Costs? North Carolina Medical Journal, 79(1), 51–55.
Himmelstein, D. (2014). A Comparison of Hospital Administrative Costs in Eight Nations: U.S. Costs Exceed All Others by Far. The Commonwealth Fund.
Woolhandler, S., Himmelstein, D. U., & Lewontin, J. P. (1993). Administrative Costs in U.S. Hospitals. The New England Journal of Medicine, 329(6), 400–403.


