Analyzing NFL Fan Health & Spending Habits by Team
With Super Bowl LVII approaching, which NFL team fans are the healthiest, and which ones are picking up the most beer and wings on game day?

It’s been well established that NFL fans consume more saturated fat and sugar after their favorite team suffers a big loss, while the reverse has been shown to happen after a win. This so-called “diet of defeat,” adopted by so many downhearted NFL fans, is an incredibly common coping mechanism to alleviate strong, typically negative emotions. Overall, the calorie consumption of a given team’s fanbase tends to increase by 10% when their team loses and decrease by 5% when their team wins.
With Super Bowl Sunday just a few weeks away, given the commonality of this indulgent behavior and its clear connection to NFL fans, we wanted to know how the fans of the various NFL teams across the U.S. might be coping or celebrating. And how do their average mental and physical health statuses compare to game day?
Jump to:
Key takeaways
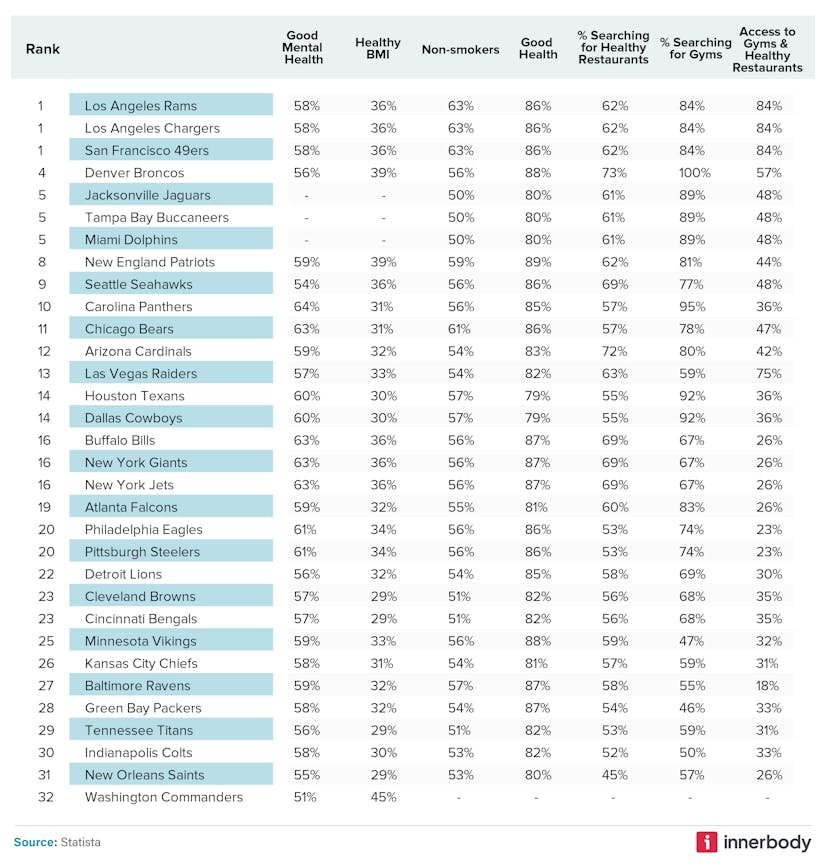
- The Los Angeles Rams and Los Angeles Chargers have the overall healthiest fans.
- The fanbase of the Carolina Panthers has the best average mental health.
- Fans of the three New York-based teams are tied for the second-best mental health overall.
- Baltimore Ravens fans have the least access to gyms and healthy restaurants (18%).
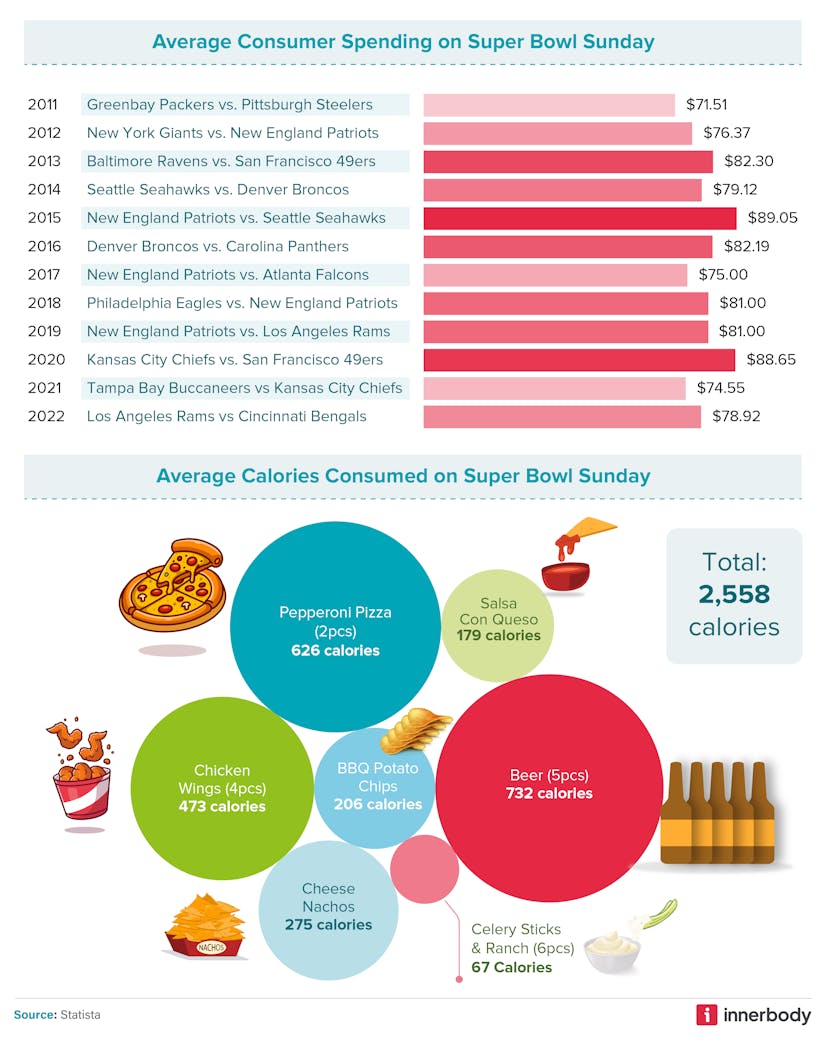
- The peak of game-day consumer spending ($89.05 per person) was during Super Bowl XLIX (2015).
- From 2020 to 2021, Super Bowl Sunday alcohol sales increased by half a billion dollars.
Overview
For many, emotional eating is a readily available and widely accepted means of escape. Using food as a catalyst, suffering individuals — not necessarily just grieving NFL fans — will try to numb, change, or even amplify their feelings. According to the Cleveland Clinic, 75% of our eating is emotionally driven, which means that we primarily eat not because we’re hungry but because we’re sad, bored, anxious, or our favorite team blew it in overtime again.
Using data gathered from the CDC’s Behavioral Risk Factor Surveillance System (BRFSS), Yelp, and Glympse (a leading consumer geo-location tracking platform), we were able to analyze and rank the health of each NFL team’s fanbase according to the following categories:
- Mental health
- Interest in physical health and healthy eating
- Access to gyms and healthy restaurants
- Body mass index (BMI)
- Smoking habits
We also analyzed individual state data to understand each team’s fan spending, drinking, and eating habits. Through this analysis, we hoped to better understand the health outcomes of American football fans as we move into Super Bowl season 2023.
The healthiest and unhealthiest NFL fans by team

The top two teams with the healthiest fans are both located in Los Angeles (the Rams and the Chargers), followed by another California-based team, the San Francisco 49ers. This could be due to Los Angeles being one of the healthiest cities in America; football fans in Southern California also have more access to gyms and healthy restaurants than those in many other states.
However, even if California has long lingered below the average rate for obesity in the U.S., research published by the New England Journal of Medicine predicts that by 2030, the Sunshine State will have caught up to the national average for adults who meet disease criteria for obesity. Perhaps on Super Bowl Sunday 2023, this revelation will inspire California football fans to revert back to their healthier eating habits.
Mental and physical health
Despite its well-known reputation as “the city that never sleeps,” New York’s collective fanbase actually ranks near the top for mental health, second only to fans of the Carolina Panthers (64%). We found that more than half (63%) of Jets, Bills, and Giants fans have good mental health. This finding is supported by a previous Innerbody study that found New York to be well below the average in terms of stressful working conditions, implying that New Yorkers, despite the stereotypes, may be less stressed than the average American overall.
Just down the coast, however, the fanbase of the Washington Commanders ranks lowest in terms of mental health. Washington fans also didn’t have the healthiest overall score in terms of BMI. Being concerned with one’s physical appearance is not inherently a mental health issue, but this common manifestation of self-criticism often comes with a range of negative aftereffects, ranging from low-level anxiety to suicidal ideation. It’s unfortunate, but NFL fans living in our nation’s capital should be aware that your looks aren’t everything, especially when you’re watching the game at home.
When it came to concerns regarding physical health, the fanbase of the Denver Broncos ended up at the top of our list. 100% of the surveyed population searched for local gyms, and fans ended up in a tie with Minnesota Vikings fans for overall good health (88%), second only to the fanbase of the New England Patriots (89%).
Health concerns
Sitting in the bottom 15% of overall health scores, Baltimore Ravens fans have less access to gyms and healthy restaurants (18%) than any other team’s followers. According to a 2017 white paper published by the Baltimore City Health Department, the leading causes of death in Baltimore were heart disease, cancer, stroke, accidents (unintentional injuries), and chronic lower respiratory diseases, many of which are avoidable with regular exercise and healthy habits. Likewise, one in every three high school students was reported to be either obese or overweight.
Nearly a quarter of Baltimore residents (23%) are regular smokers (compared to the state average of just 15%); Baltimore also reportedly has some of the highest rates for heroin use and overdose in the country. All of these factors certainly could contribute to, or be correlated with, Ravens fans’ low position in our health ranking.
Super Bowl expenses and calories consumed

On any given Super Bowl Sunday, Americans consume more calories on average than any other time of year, including Thanksgiving, based on the total number of calories per serving of all food items purchased over the week leading up to the Super Bowl. On average, Americans will consume more than 1.2 billion chicken wings, 11 million slices of Domino's pizza, 11.2 million potato chips, 8.2 million pounds of tortilla chips, and all sorts of other calorie-rich foods, especially if their team loses.
A typical game-day menu for one person might look something like this:
- Pepperoni pizza (2 slices): 626 calories
- Salsa con queso (1 serving): 179 calories
- Chicken wings (4 wings): 473 calories
- BBQ potato chips (1 serving): 206 calories
- Beer (5 cans): 732 calories
- Celery sticks with ranch (6 sticks): 67 calories
- Cheese nachos (1 serving): 274 calories
This means that an average person consumes 2,558 calories on game day, which is more than 500 calories over the recommended daily limit. Eating more than you’re supposed to is okay in moderation, but considering the caloric uptick that comes with your favorite team losing, be mindful to avoid the slip from a big game-day meal to binge eating.
Game-day spending
According to our analysis, game-day consumer spending peaked during Super Bowl XLIX (2015), when the New England Patriots played the Seattle Seahawks, at an average of $89.05 per person. The Patriots have played in four other Super Bowls in the past 12 years, but none of those games drummed up as much consumer excitement as their victory in 2015.
In 2018 and 2019, they played in back-to-back Super Bowls against the Philadelphia Eagles and Los Angeles Rams, respectively, but game-day consumer spending only amounted to an average of $81.00 per person. Perhaps the increased sales numbers noted in 2015 were due mainly to the hopeful enthusiasm of Seattle fans, whose team won the Super Bowl the previous year by crushing the Denver Broncos 43-8.
The Super Bowl Sunday with the second highest numbers for game-day spending (an average of $88.65 per person) occurred in 2020 when the Kansas City Chiefs played the San Francisco 49ers. The game took place in early February, less than three weeks since the U.S. reported its first confirmed case of COVID-19; international travel was still wide open, and the Raymond James Stadium in Tampa, Florida, where they played the game, was filled with fans. So, it’s likely that many Americans did not put their Super Bowl party plans on hold, though they didn’t know what the coming months would hold.
Home stadium beer prices
Many of the teams’ whose home stadiums charged the most for a 16-ounce beer were also the teams with the smallest reported fanbases:
- Tennessee Titans (1 million fans): $10.50
- Jacksonville Jaguars (0.6 million fans): $11.50
- Los Angeles Rams (0.9 million fans): $13.75
- Los Angeles Chargers (1.5 million fans): $13.75)
Lincoln Financial Field, home of the Philadelphia Eagles, charges more for a 16-ounce beer than any other stadium ($14.67) and has a relatively average-sized fanbase (3.1 million). Notably, these numbers don’t follow each city’s average cost of living or their favorite beer choices.
At the other end of the scale, the home stadiums for the Detroit Lions, Atlanta Falcons, New York Jets, and Cincinnati Bengals all charge less than $7.00 for the same 16 ounces of frosty Bud Light. However, in terms of overall health, Jets fans ranked 16 of 32, while the other three teams fell below that halfway point. The dramatically lower cost of alcohol at their respective stadiums, one could argue, might just be related to the below-average health of their fans.
Super Bowl Sunday alcohol sales

Retail sales of alcohol in the U.S. saw a massive increase overall in 2021, reaching nearly $250 billion. In line with this trend, Super Bowl Sunday alcohol sales increased from $3.13 billion in 2020 to $3.63 billion in 2021 — that’s a half-billion-dollar jump compared to the $0.03 billion increase reported in 2022. When the game was played in February 2021, most U.S. states had some variation of COVID-19 dining restrictions, which could have influenced many football fans to purchase their favorite beverages and watch the game at home.
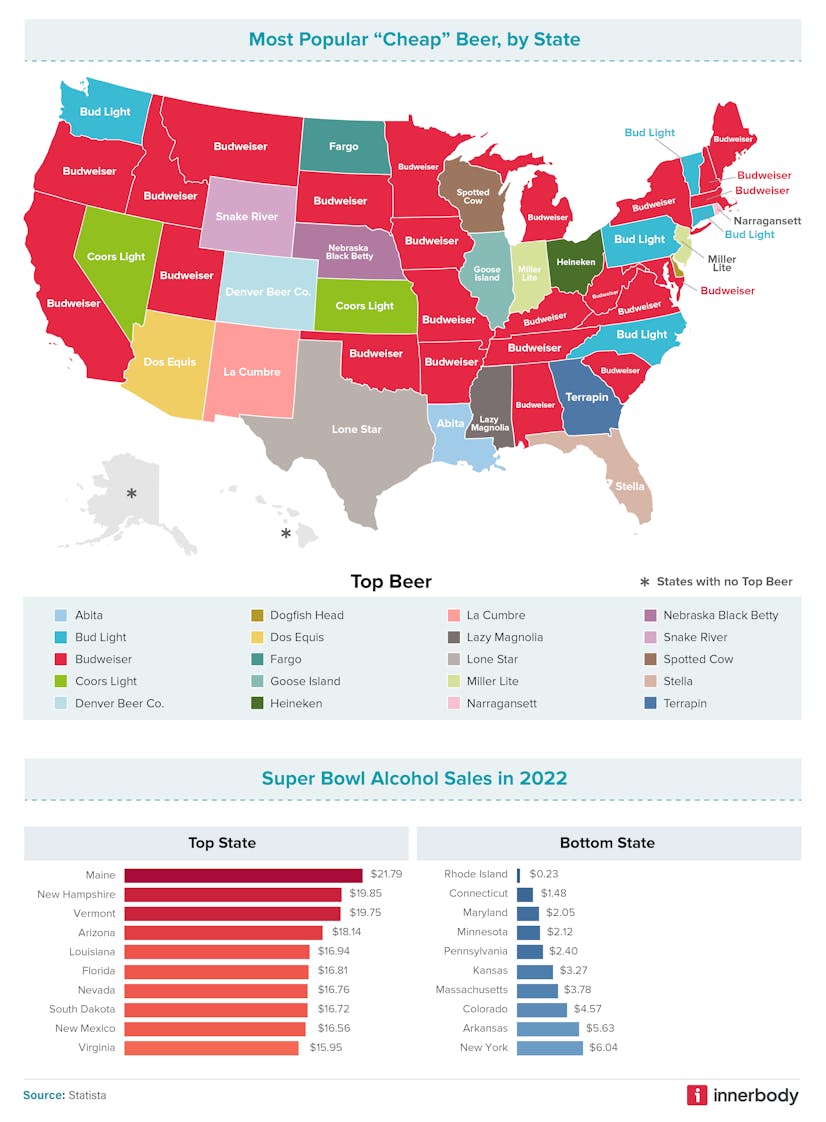
The three states with the highest Super Bowl Sunday per-person alcohol sales were Maine ($21.79), New Hampshire ($19.85), and Vermont ($19.75). This finding coincided exactly with a previous Innerbody study on how the eating habits of each state changed during the COVID-19 pandemic.
The bottom three states for per-person alcohol sales on Super Bowl Sunday were Rhode Island ($0.23), Connecticut ($1.48), and Maryland ($2.05). Only one of these states, Maryland, is home to an NFL team, the Baltimore Ravens, who had a relatively unimpressive 2022 season (10-7). This could partly explain why we found these three states at the bottom of our list: they had little or no reason to celebrate.
Beer preferences by state
When it comes time for kickoff this February, we wanted to know which brand of beer Super Bowl LVII fans in each state were likely to sit down with. There was no data available for Alaska, Hawaii, or Washington, D. C., but we found an overwhelming number of states appeared to be going with Budweiser:
While Connecticut, North Carolina, Pennsylvania, Vermont, and Washington all went for Bud Light, another Anheuser-Busch brand, preferences varied throughout the rest of the states:
- Arizona: Dos Equis
- Colorado: Denver Beer Co.
- Delaware: Dogfish Head
- Florida: Stella Artois
- Georgia: Terrapin
- Illinois: Goose Island
- Indiana: Miller Lite
- Kansas: Coors Light
- Louisiana: Abita
- Mississippi: Lazy Magnolia
- Nebraska: Nebraska Black Betty
- Nevada: Coors Light
- New Jersey: Miller Lite
- New Mexico: La Cumbre
- North Dakota: Fargo
- Ohio: Heineken
- Rhode Island: Narragansett
- Texas: Lone Star
- Wisconsin: Spotted Cow
- Wyoming: Snake River
Methodology
Using data gathered from the CDC’s Behavioral Risk Factor Surveillance System (BRFSS), Glympse (a leading geo-location tracking platform), and Yelp, we were able to analyze and rank each NFL team’s fanbase according to the following categories: mental health, interest in physical health and healthy eating, BMI, and smoking. We also broke down and analyzed state data to understand the spending, drinking, and eating habits of each team’s fanbase. Through this analysis, we hoped to better understand the health outcomes of American football fans, as we move into Super Bowl season 2023.
Fair use statement
Innerbody Research is committed to providing objective, science-based suggestions, and research to help our readers make more informed decisions regarding health and wellness. We invested the time and effort into creating this report to analyze the health of each NFL team’s fanbase, in the hope of finding any correlations between team preference and fan health, as well as their spending, drinking, and eating habits. We hope to reach as many people as possible by making this information widely available. As such, please feel free to share our content for educational, editorial, or discussion purposes. We only ask that you link back to this page and credit the author as Innerbody.com.
Sources
Vedantam, S. (2013, September 20). Diet of defeat: Why football fans mourn with high-fat food. NPR. Retrieved January 19, 2023, from https://www.npr.org/sections/thesalt/2013/09/20/224148230/diet-of-defeat-why-football-fans-mourn-with-high-fat-food
Cleveland Clinic. (2021, November 11). Emotional eating: What it is and tips to manage it. Cleveland Clinic. Retrieved January 19, 2023, from https://health.clevelandclinic.org/emotional-eating/
Ward, Z. (2019, December 19). Projected U.S. state-level prevalence of adult obesity and severe ... The New England Journal of Medicine. Retrieved January 19, 2023, from https://www.nejm.org/doi/full/10.1056/NEJMsa1909301
Eaton, L. (2019, May 17). How much does poor body image affect mental health? The Guardian. Retrieved January 19, 2023, from https://www.theguardian.com/society/2019/may/17/poor-body-image-mental-health
State of Health in Baltimore: White Paper 2017. Baltimore City Health Department. (2022, May 12). Retrieved January 19, 2023, from https://health.baltimorecity.gov/state-health-baltimore-winter-2016/state-health-baltimore-white-paper-2017
Centers for Disease Control and Prevention. (2022, August 16). CDC Museum Covid-19 Timeline. Centers for Disease Control and Prevention. Retrieved January 19, 2023, from https://www.cdc.gov/museum/timeline/covid19.html
Pope, L. (2014, December 16). New Year's RES-illusions: Food shopping in the New Year competes with Healthy Intentions. PloS one. Retrieved January 20, 2023, from https://pubmed.ncbi.nlm.nih.gov/25514158/
Ferdman, R. A. (2021, November 25). The crazy amount of calories Americans eat during the Super Bowl, in one chart. The Washington Post. Retrieved January 20, 2023, from https://www.washingtonpost.com/news/wonk/wp/2015/01/28/the-crazy-amount-of-calories-americans-eat-during-the-super-bowl-in-one-chart/
Published by Jan Conway, & 25, N. (2022, November 25). Alcoholic beverage sales in the U.S. 2021. Statista. Retrieved January 20, 2023, from https://www.statista.com/statistics/207936/us-total-alcoholic-beverages-sales-since-1990/
Andrews, C. (2021, January 2). Mask mandates, limited capacity: These are each state's reopening restaurant restrictions. USA Today. Retrieved January 20, 2023, from https://eu.usatoday.com/story/money/2021/01/02/restaurant-reopening-restrictions-in-every-state/43303369/
Baker, N. (2023, January 6). The price of a beer at every NFL stadium (2022). VinePair. Retrieved January 11, 2023, from https://vinepair.com/booze-news/beer-prices-nfl-stadiums-2022/
Cameron, M. (2022, February 7). The #1 most popular super bowl beer. Eat This Not That. Retrieved January 11, 2023, from https://www.eatthis.com/news-most-popular-super-bowl-beer/
Centers for Disease Control and Prevention. (n.d.). Centers for Disease Control and Prevention. Retrieved January 12, 2023, from https://www.cdc.gov/
Gough, C. (2022, February 10). Topic: National Football League (NFL). Statista. Retrieved January 11, 2023, from https://www.statista.com/topics/963/national-football-league/#dossier-chapter1
Last mile customer experience. Glympse. (2023, January 11). Retrieved January 12, 2023, from https://www.glympse.com/
Most popular beer. TOP Agency. (2022, September 28). Retrieved January 12, 2023, from https://topagency.com/report/most-popular-beer/
NRF: Homepage. National Retail Federation. (2023, January 11). Retrieved January 12, 2023, from https://nrf.com/
Tighe, D. (2022, April 22). Super Bowl average consumer spending 2011-2022. Statista. Retrieved January 11, 2023, from https://www.statista.com/statistics/251064/super-bowl-sunday-average-consumer-spending/
Weekly Retail Food Sales. USDA ERS - Weekly Retail Food Sales. (n.d.). Retrieved January 12, 2023, from https://www.ers.usda.gov/data-products/weekly-retail-food-sales/
Yelp. (n.d.). Retrieved January 12, 2023, from https://www.yelp.com/
Weekly Retail Food Sales. USDA ERS - Weekly Retail Food Sales. (n.d.). Retrieved January 12, 2023, from https://www.ers.usda.gov/data-products/weekly-retail-food-sales/


